
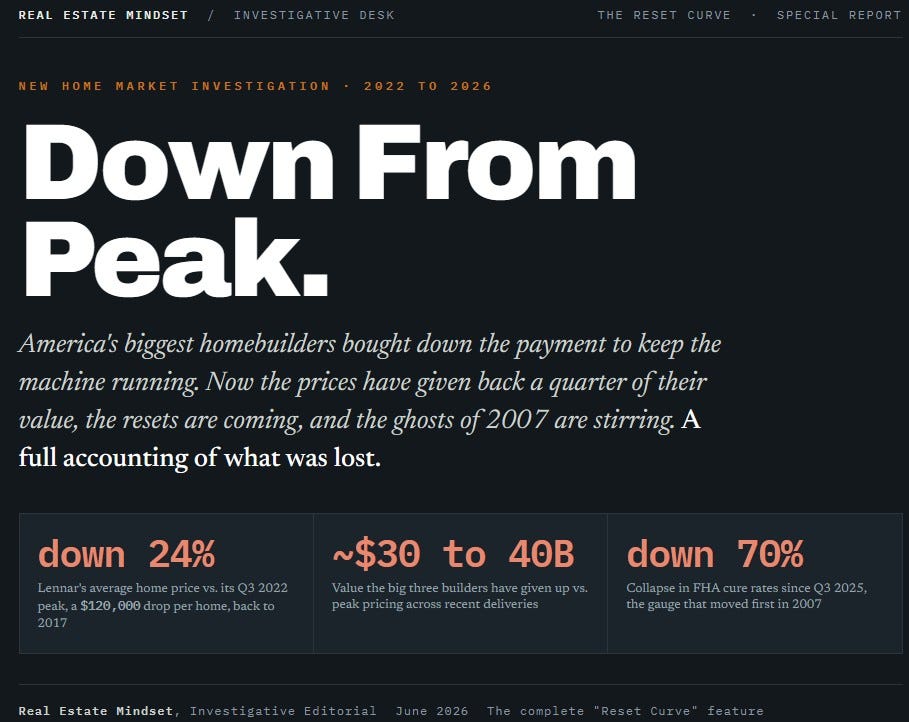
DOWN FROM PEAK
New Home Market Investigation 2007 VS 2026

What this report establishes
It began as a question about viral videos, new homes falling apart, mortgage payments lurching upward, buyers full of regret. Tens of millions of views don’t make a thesis, but they are a signal worth following. Following it leads to a hard set of numbers: builders sold the cheap payment, not the cheap house, and to do it they let prices fall, Lennar by 24% from its 2022 peak, while propping the sticker with rate buydowns now embedded in roughly two thirds of big builder sales.
That structure rhymes with 2007: a low entry payment, a promise to refinance later, an exit that closes when prices stop rising. The early warning gauges, cure rates, FHA distress, the return of adjustable loans, are flashing on exactly the buyers the builders bought down. And this time the rerun is loading, the early stage already on the ground in prices that have begun to fall and cure rates that are collapsing. Exactly one number is genuinely better than 2007, the headline mortgage delinquency rate at 1.6% against 2%, and it is a lagging gauge that read just as calm in 2007 before it broke. Everything else is worse: record total debt, prices further above income than the 2006 peak, consumer and corporate credit defaulting at or above 2007 levels, and a bill now aimed at the consumer, who gets no bailout. This report lays the whole chain out, the noise, the price collapse, the mechanism, and the echo, and tells you, without flinching, where the danger is real and where it stops.
What is inside this investigation
A complete accounting of the 2022 to 2026 new home market: the builder buydown machine, the price declines already on the board, and how closely 2026 is tracking the run up to 2008. Inside you will find twelve original data exhibits, two side by side comparison tables, and the full verdict.
Free readers get the signal. Paid subscribers get the full investigation below: the mechanism, the complete 2007 comparison, all twelve data exhibits, both comparison tables, and the verdict.
Part I · The noise from the ground Free preview
The viral signal that set this off: brand new homes coming apart on camera, payments lurching upward, buyers full of regret, and why tens of millions of views were worth following.
Part II · The price collapse
How far prices have already fallen from the 2022 top, builder by builder. The Sunbelt epicenters where buyers actually ate the loss, and the tens of billions in value the three largest builders have already surrendered.
Data exhibits The fall, builder by builder · Where the propped up prices cracked first · The give back, scaled up
Part III · The mechanism
How the monthly payment got cheap while the sticker price stayed high. Permanent versus temporary buydowns, why close to two of every three new homes now carry one, and what that conceals about the true price.
Data exhibits Two of three at the top of the market
Part IV · The 2007 question
The heart of the report. The single variable that actually pulled the trigger last time, the early warning gauges moving right now, and the finding that the risk did not shrink, it shifted onto the consumer who gets no bailout. Includes the full 2007 versus 2026 scorecard and a named record of who is sounding the alarm and who is waving it off.
Data exhibitsLower than 2007, for now · The exit is not free · The needles are moving · More money is riding on housing than ever · The distress did not shrink, it spread · The unsold pile, 2007 vs 2026 · Higher against income than the 2006 bubble · The leverage moved upmarket, and it is cracking
Part V · The verdict
Where this lands, without flinching. The one number that is genuinely better than 2007, why it will not save anyone, and the only honest questions left to ask.
Notes and Sources
Every figure traced to its origin: builder filings, the New York Fed, ICE, the Census Bureau, the Mortgage Bankers Association, Freddie Mac, and Fitch.
Part I
The noise from the ground
Before the data, there was the feed: millions of people watching new homes come apart and payments lurch upward. The canary, not the proof.
What tens of millions of views were trying to say
The cultural signal arrived first. Home inspectors filming brand new builds became some of housing’s biggest creators: a walkthrough of a $2.7 million new build drew roughly 24 million views; a New York inspector’s “finished” home that wasn’t pulled 21 million; a $3 million build montage, 13 million. Soft banisters, wobbling rails, miswired outlets, packaged as dark comedy and devoured by an anxious audience.
Beneath the inspector content ran a rawer vein: buyer regret. A Houston woman’s Lennar home was deemed effectively uninhabitable less than two years after purchase, with airborne mold spore counts that professionals called unsafe. Another homeowner filmed her living room floor visibly sinking as she walked across a slab. And a parallel genre exploded around the payment itself, a creator telling followers her mortgage had jumped a thousand dollars and that she felt “bamboozled,” the increase traced not to her fixed rate but to an escrow reassessment her builder never clearly explained. None of this is evidence on its own. But when millions of people are watching the same thing break, it is worth asking what they’re seeing. Sources: We Got This Covered; Newsweek; Daily Dot; Hunterbrook Media.